
Click here to download the MT4 Pivot Point Indicator.
History and Application of Pivot Points
Pivot Points are being used more and more by Forex Traders and are an excellent tool for calculating entry and exit points as well as levels for Stops. Pivot Points are super sized-support and resistance levels that are calculated from the price action from the previous day. The reason these levels are superior to Fibonacci levels is because there is no subjectivity involved in calculating them. For example, when choosing a range to mark Fibonacci levels one person may choose a range from the one hour and another person might choose a different range all together which would result in 2 different sets of support or resistance’s. These systems of finding support and resistance are very subjective and therefore are prone to human.
Pivots, however, are based on the High, Low, and Close of yesterday’s price action and therefore there will be very little fluctuation in the results. Pivots are good at forecasting short term price levels because they are reflective of both short-term volatility and trader psychology. I calculate my levels from midnight to midnight eastern standard time. Calculating pivots for the last session is measuring short-term volatility and direction. Pivots also reflect trader psychology in that major pivot points are also: major Fibonacci retracements, major levels of support or resistance, and sometimes Elliot Wave retracement levels.
While all three of these types of systems are quite subjective, there will be enough traders in the market using these methods to turn a pivot point into a ‘battle ground’ between buyers and sellers. Price action speeds up around pivot points and makes it a lower-risk entry or exit point. Remember, no system will forecast with 100% success. What we’re seeking to do is lower our entry and exit risk and raise our odds above random entry. By only entering around pivots we can minimize our risk greatly. Pivots are made up of 1 pivot line, which is the center of the range, 3 levels of support, and 3 levels of resistance. The calculator included with this course will also calculate an additional 6 levels. These levels are called mid-pivots and are used for intermediate targets and possible entry levels. It is advised to implement these using a breakout strategy rather than a reversal point. These levels act just like a regular pivot however they can be slightly weaker.
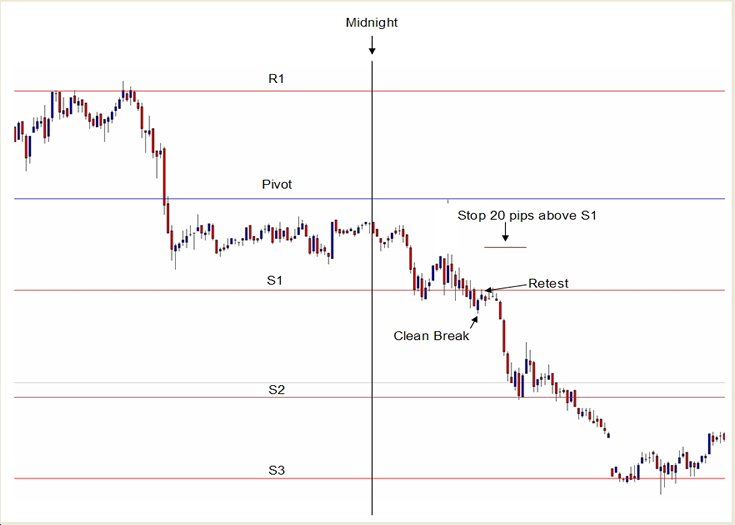
The first strategy for using pivot points is to trade pivot breaks with the momentum. Successful Pivot trading greatly depends on the momentum of the market and current volume. If volume is low it is best to pass on the trade unless you have overwhelming indications of a trade. Providing you have proper volume and momentum you would go short when one of the support levels are breached and long when a resistance level is breached. Keep in mind that resistance becomes support and support becomes resistance once broken. You want to wait for a convincing breach to ensure that the market has indeed broke the level. Usually waiting for 1 or 2 (15 min) candles to open and close on the opposing side of the level ensures that the market has broken the level. Always enter as close to a pivot as possible. This will limit the risk you take on in each trade as stops should be approximately 20 pips above or below the broken level. Many times the market will return to the level that was broken before continuing on; this provides an excellent entry with a very tight stop. You should not enter between two pivots if at all possible as this will increase your risk by increasing the necessary stop for the trade. Below is an excellent example of a break below the S1 level which is with the overall momentum of the market. This illustrates a clean break followed buy a retest which gave an excellent short entry with minimal risk.
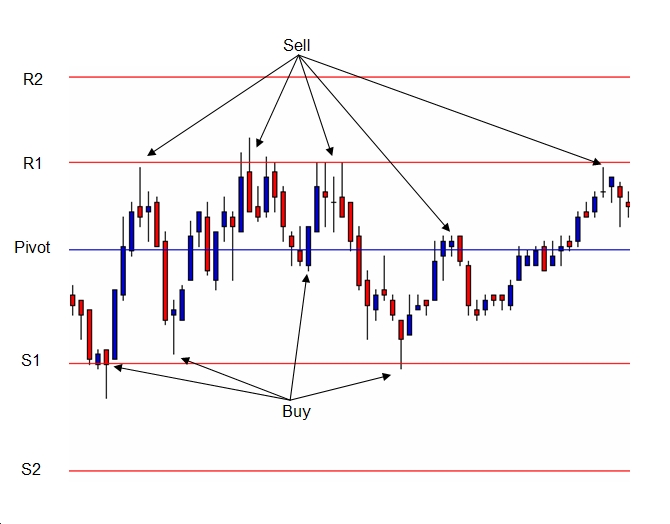
The second strategy for trading pivots would be using these levels as reversal entries. When the market is moving towards a Pivot level your entry would be to buy off of support and sell from resistance. This strategy works best when the market is range bound. You must watch these trades very carefully because they are against the overall push. If a support level is breached and the market lingers below for to long you should look for an exit opportunity. As I stated earlier, the market tends to revisit the level which will give you the opportunity to exit the trade with little or no loss. If a level is good for a bounce it will generally reverse fairly quickly. Therefore, if you don’t see profit after 30 to 60 minutes you should be very cautious and once again begin looking for an exit. The example below illustrates a low volume day where that market is range bound. Under these conditions you would sell the resistance and buy the support using close stops and target 50% of the distance between the levels. This is a good example of a range bound market.
…
…
Camarilla Pivots
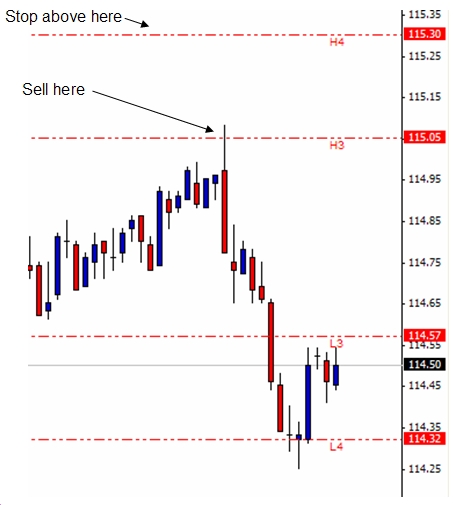
The Camarilla Equation produces 8 levels from yesterday’s open, high, low and close. These levels are split into two groups, numbered 1 to 4; for simplicity we only use 4 of the 8 levels. The 4 levels are L3, L4, H3, and H4. Traditionally traders would anticipate a reversal at either the H3 or L3 levels and would take a position against the immediate market direction. Stops would be placed above or below the H4/L4 levels; however, the risk associated with this type of stop can be unacceptable at times so I encourage you to use the information in this course to locate a shorter stop. In the example below a sell position would have been opened at the H3 level and a stop would have been placed 5 to 7 pips above the H4 level. The stop placement is relative to the market you are trading. Some crosses are more volatile than others; therefore, you may set your stop 12 to 15 pips above H4 if you are trading a more volatile currency. Access the Camarilla calculator by saving it to your desk top.
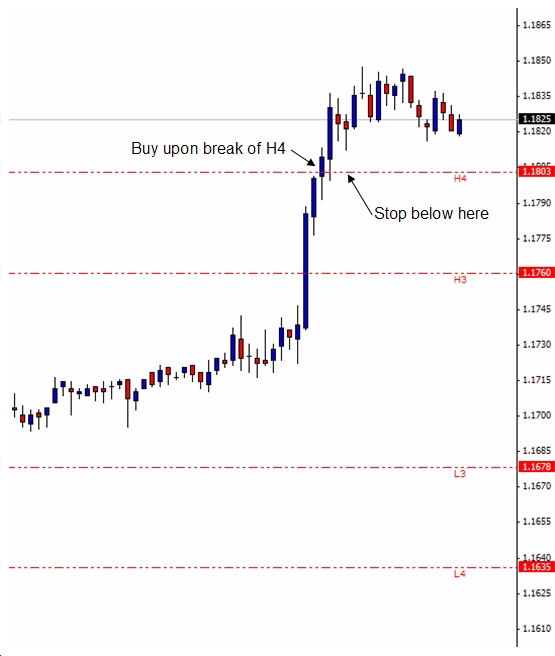
The alternative method to trading these levels is to wait until either an H4 or L4 have been breached and trade in the direction of the trend. I prefer breakout trades for the simple reason that you are trading with the current market volume. In the example below a long position would be taken when the market breaches the H4 level and your stop would be placed 12 to 15 pips below the H4 level. There is some subjectivity when trading these levels as to where to take profit; however, that is why we have included the tunnel information. Armed with the knowledge found within this course it should be no problem to find an exit point using Fib levels Pivot Points and the tunnel trading strategy.
…